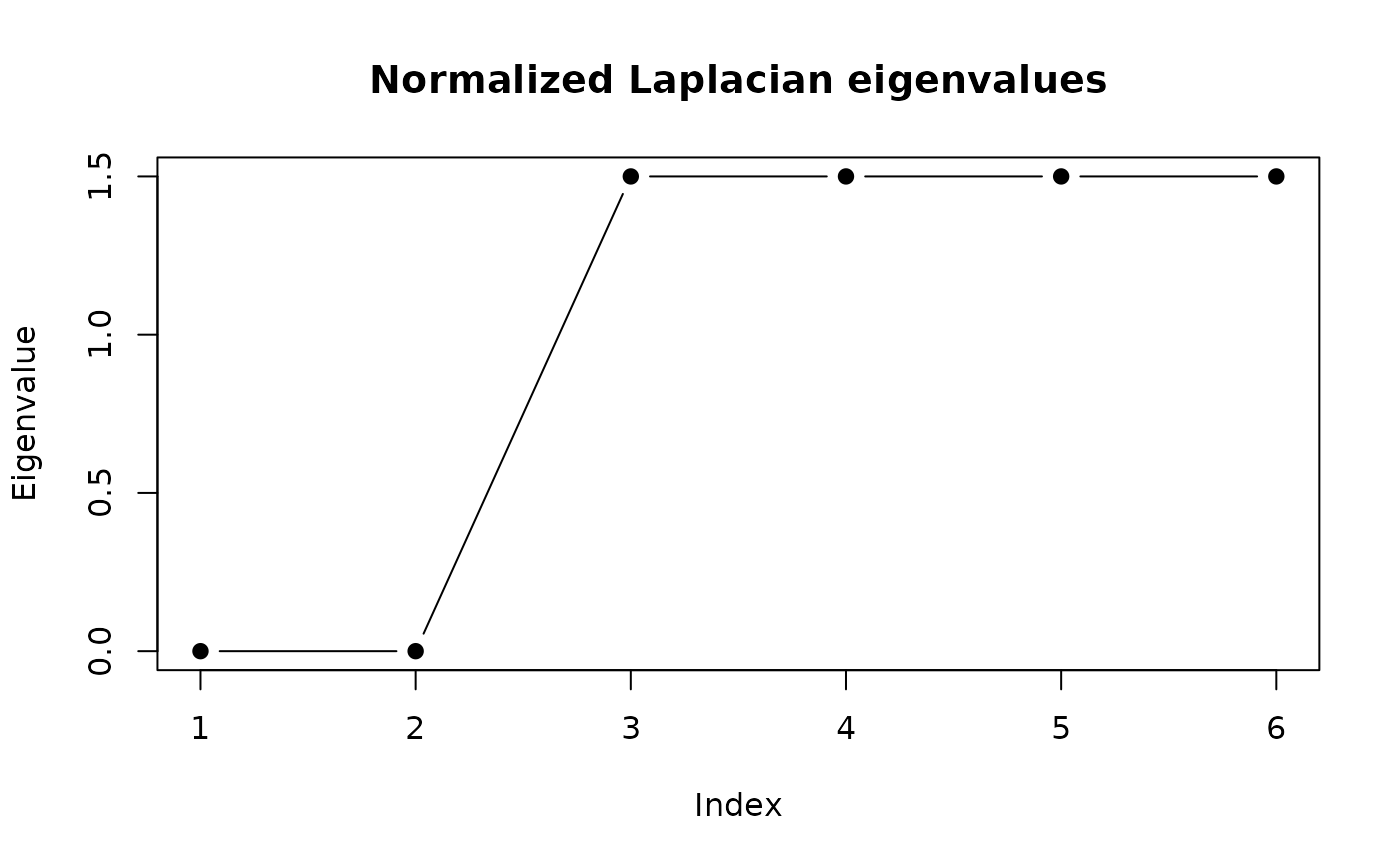
Diagnostic plots for an outrank_clust object.
Arguments
- x
An
outrank_clustobject fromcluster_traces().- type
One of
"dendrogram"(the hierarchical tree; built onas.dist(1 - S)when the clustering was spectral),"eigenvalues"(the smallest normalized-Laplacian eigenvalues), or"profile"(the distribution of a caseattributeacross clusters).- attribute
For
type = "profile", the name of a case attribute carried by the underlyingsim.- ...
Passed to the underlying plotting call.
Examples
m <- matrix(0.1, 6, 6); m[1:3, 1:3] <- 0.9; m[4:6, 4:6] <- 0.9
diag(m) <- 1; dimnames(m) <- list(1:6, 1:6)
crit <- criterion(m, "similarity", indifference = 0.3, similarity = 0.95)
tr <- as_traces(data.frame(case = as.character(1:6), act = "x",
                           ts = as.POSIXct("2020-01-01")),
                "case", "act", "ts")
clust <- cluster_traces(outrank_similarity(tr, crit), k = 2, seed = 1)
plot(clust, type = "eigenvalues")